Batch Rendering 3D Views of Elevation Data
January 20, 2025
After finishing my large research project, I have been exploring other areas to learn and work in. In my last project, I did a lot of work with TIFs and DEMs, to the point where I grew frustrated with existing code. This blog post details a work-in-progress project I have started that focused on lightweight generation of static horizon images from DEM files. This blog post uses excerpts from my white paper, so the style will jump around a bit.
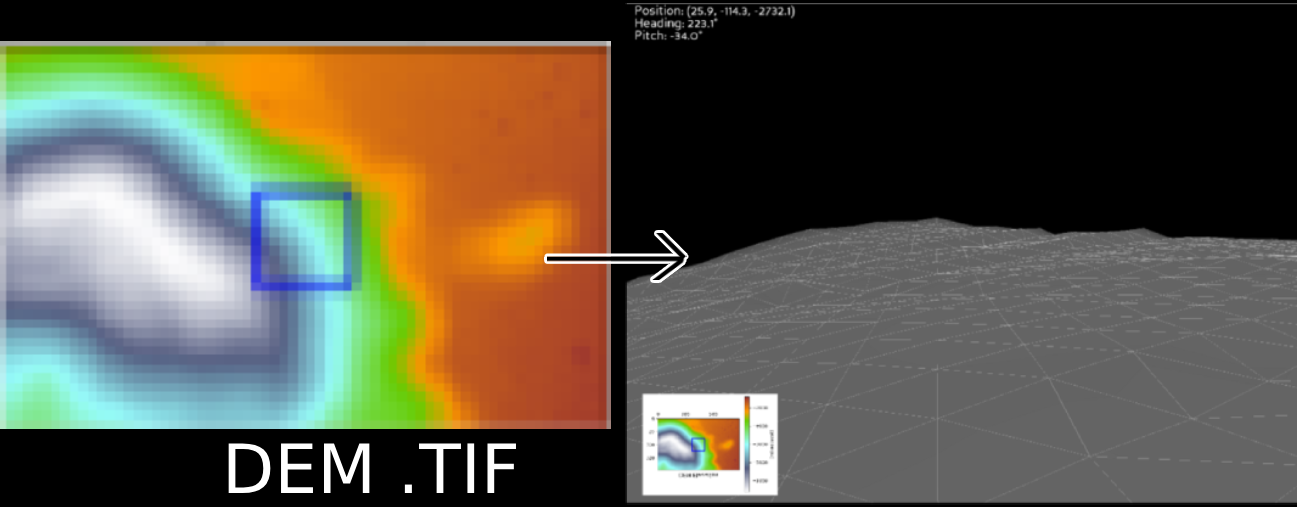
Large DEM files can be difficult to work with. Extracting and analyzing smaller, relevant sections streamlines workflow and reduces computational load. Existing methods for rendering DEM data into horizon images or interactive environments often require high computational power, making them unsuitable for real-time or resource-constrained scenarios. This program was created with the intention of generating tens of thousands of basic horizon images of the lunar surface. In testing, I created an interactive environment for verifying scale and evaluating distances. This program allows for static and interactive DEM processing with a lightweight pipeline.
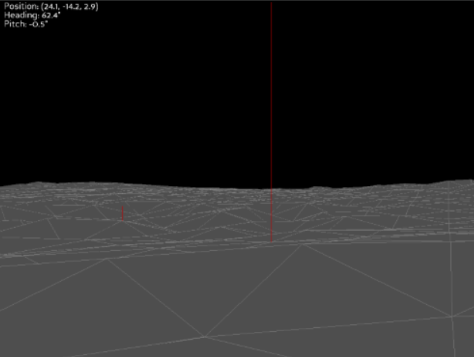
Pictured below: The developed interactive program, showcasing rule lines of different lengths.
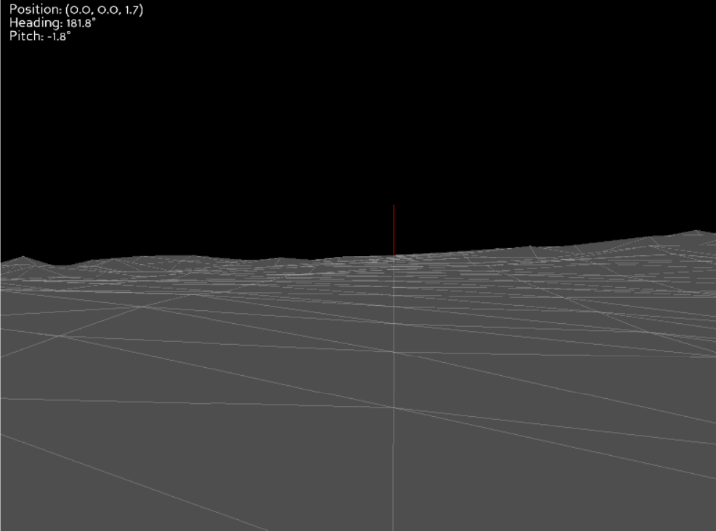
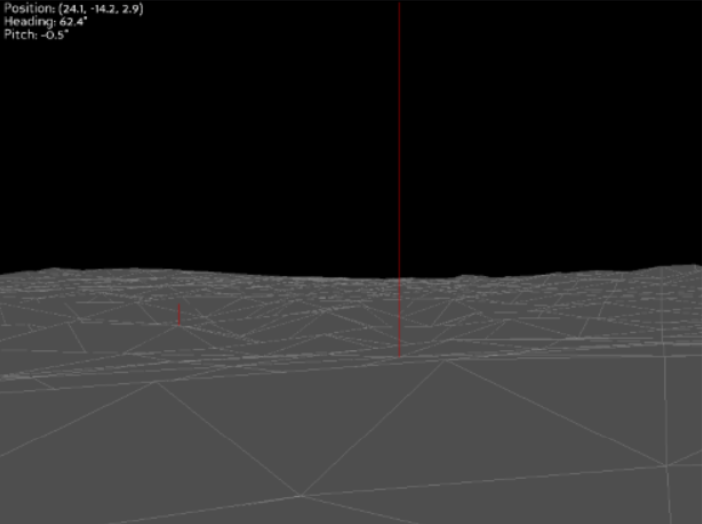
The smaller red bar is 1 meter tall, and the larger red bar is 100 meters tall. In the first image, they are 1km away, and in the second image, they are 100m away.
Overview of the Program
My approach combines existing algorithms with optimized data processing techniques to be both efficient and scalable. The implementation has two main parts: Panda3D for interactive rendering and collision handling, and a combination of libraries for static image generation. I will break this down to be step by step
- The tool accepts standard DEM formats (e.g., GeoTIFF, ASCII grid).
- The DEM is sliced to a specified size and turned into a 3D mesh.
If the program is generating static images:
- Elevation data is processed to extract horizon profiles at specified angles and coordinates. A ray-casting algorithm calculates visible horizon lines, which are represented as images.
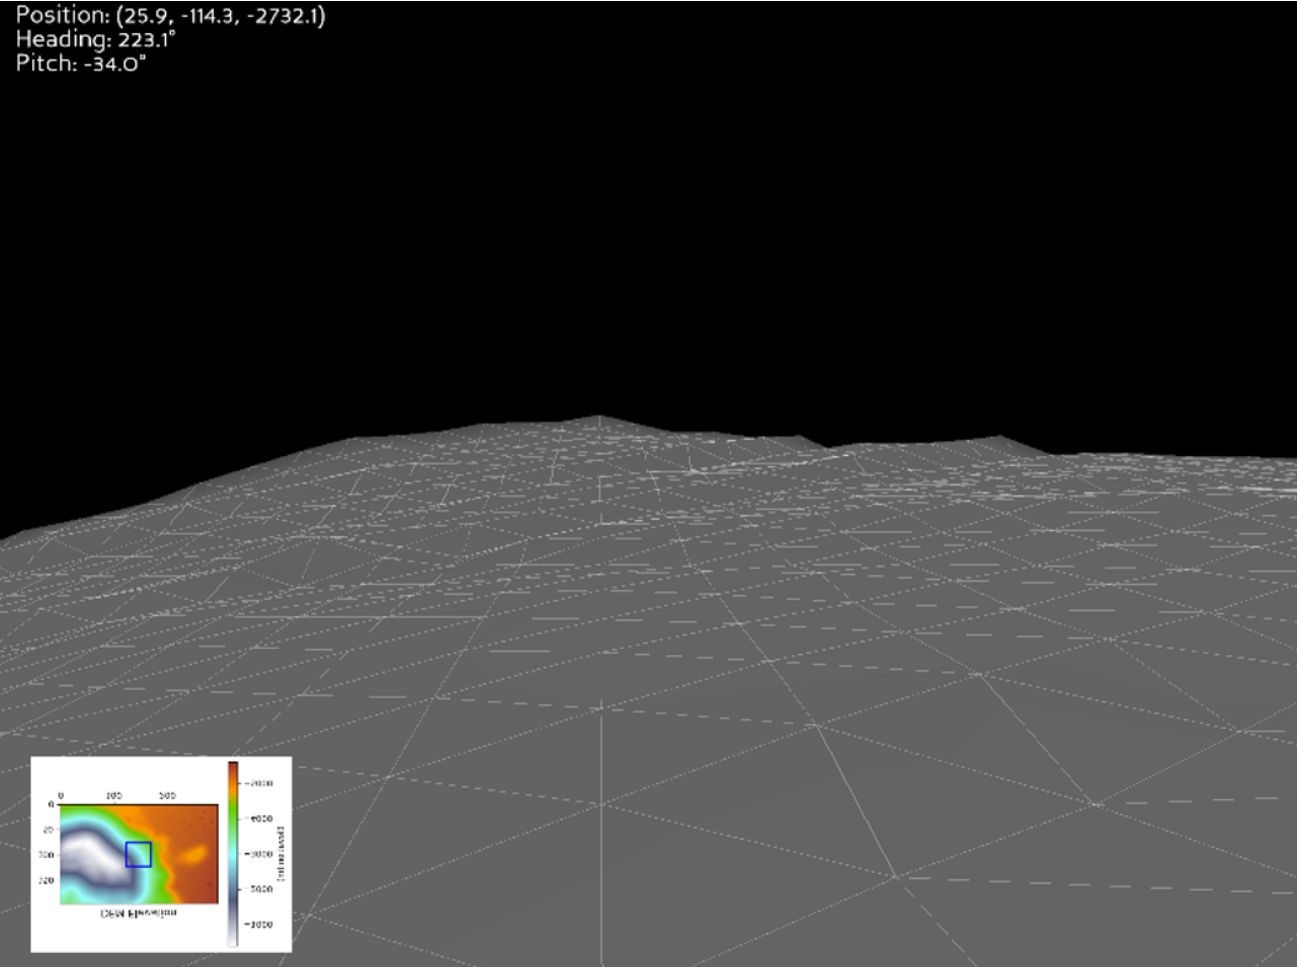
- A top-down view of the DEM with the camera position is generated and saved alongside the horizon images.
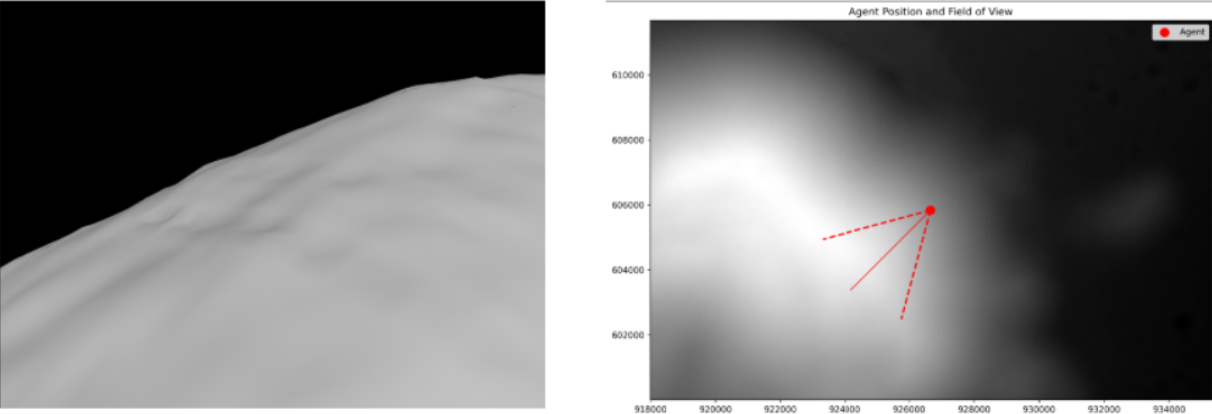
Here is an example of a generated pair of images from this pipeline:
- If more than one image has been requested, steps 3 and 4 are repeated. The more images that are generated, the more efficient this program is. Most of the computational overhead comes from generating the 3D mesh.
If the program is generating an interactive environment:
- Using Panda3D, terrain is generated by converting DEM data into vertex grids. Heights are calculated for each vertex, and normals are derived for realistic lighting.
- The lightweight rendering engine supports dynamic camera controls, including zoom, pan, and first-person navigation, allowing users to explore terrains interactively.
- A minimap provides a bird's-eye view of the terrain, with a dynamic indicator to show the user's position.
See images of some Panda3D generated views here:
Challenges (many)
- The largest challenge I have encountered would definitely be the scale of the generated mesh. The moon elevation map is pretty low-resolution (85 meters/pixel) for a task like this, and there are no real objects that can help verify scale. I have generated hundreds of images where I end up measuring the heights of hills in pixels and comparing to the expected heights of the real hills. Adding to this issue, there are many elevation maps of the moon, each with different resolutions. While I can measure the pixel height of a hill, we can only estimate the real height with +/- 5% accuracy.
- Another issue is the massive amount of data that I am working with from the moon. When I load in a DEM, the default coordinates are tens of thousands of kilometers from the center, so all maps need to be normalized around 0 (shifted, not damaged). The heights of the hills in one particular slice start at -4,000 meters and go up to -3,200 meters, which causes a lot of unexpected problems in popular python rendering libraries.
- If I end up on the steep side of a mountain, the camera will almost always clip into the ground for ½ of the views, leaving the other 50% of images useless.
Main Breakdown of the Code
All of this code is available for download and review at https://github.com/adamnelsonarcher/TIF-to-image.There are plans to make this a publicly available Python library, but for now, the code can be cloned from my Github repo. Below is a very general overview of the code used in this project.
1. Mesh Creation
Using elevation data, the create_mesh_from_dem function generates a 3D mesh. The script defines the relationship between each point's elevation and its geographic location, creating a surface model:
mesh = create_mesh_from_dem(dem_data, transform)
This step efficiently handles standard DEM formats such as GeoTIFF and ASCII grid.
2. Observer Placement and Viewpoint Calculation
Observers are placed in a circular pattern around the center of the terrain, as shown below:
for i in range(num_views):
    angle = (2 * np.pi * i) / num_views
    x_pos = center[0] + observer_radius * np.cos(angle)
    y_pos = center[1] + observer_radius * np.sin(angle)
This attempts to reduce the number of "bad placement" errors I was getting. Sometimes, very specific points in the 3D mesh produce very bad images (pics below) and moving the camera around in a small area can help bring the error rate down.
3. Rendering with Panda3D (if using the interactive viewer)
The SimpleCameraViewer class, built with Panda3D, enables real-time navigation and rendering of the terrain. This viewer supports:
- Collision detection for realistic camera-ground interactions.
- Customizable lighting and wireframe overlays for better terrain visibility.
app = SimpleCameraViewer(create_default_terrain=True, dem_data=dem_data, pixel_size=pixel_size)
app.run()
The lightweight rendering engine supports dynamic camera controls, including zoom, pan, and first-person navigation.
Panda3D is super helpful for what I need to do, but was only created to verify scale. In the final product, there will not be interactive 3D capabilities, as I am focusing on as lightweight of a build as possible.
4. Field of View Visualization
A unique aspect of this project is visualizing the field of view (FoV) in a top-down view, which is rendered with Matplotlib. This provides intuitive visual feedback on what part of the terrain each camera covers.
draw_agent_on_dem(dem_data, transform, observer_position, look_target, filename)
This was just created to show specifically where in the DEM you are. I am dealing with DEMs that are hundreds of kilometers in size, so being able to highlight a specific area helps to verify if the generated terrain is the correct scale or not.
This project presents a step in making DEMs more accessible and functional for a wide range of applications. This tool represents an advancement in lightweight horizon generation, where current software falls short. Further development on the project could result in an elegant method of visualizing any terrain with a simple coordinate input and an elevation map.